
What Really Happens During an Ammonia Release?
- MySafety LLC
- Dec 6, 2025
- 6 min read
Understanding how ammonia behaves when it is accidentally released is extremely important for protecting people, facilities, and the environment. When stored under pressure, ammonia can rapidly turn into a mixture of gas and cold liquid droplets known as a two-phase release, that creates visibility hazards, breathing risks, and unpredictable movement through indoor spaces.
The following information is a simplified technical summary of the 186-page Jack Rabbit III laboratory study conducted by the U.S. Department of Homeland Security. In this study, researchers released small amounts of pressurized ammonia inside a controlled test chamber so that temperature, humidity, and other environmental conditions could be adjusted and studied. By monitoring gas concentrations, liquid pooling, cloud visibility, and residue formation, the research provides valuable insight into how real-world ammonia leaks behave and how quickly they disperse.
Ammonia is widely used in agriculture, refrigeration, energy systems, and industrial manufacturing. Although it offers strong thermodynamic properties and a favorable carbon profile, ammonia presents critical hazards if accidentally released, especially in pressurized systems. The Jack Rabbit III (JR III) study findings were released in March 2025 and was executed to close longstanding knowledge gaps regarding ammonia dispersion, chemical behavior, and exposure potential during accidental releases. This project simulated pressurized two-phase ammonia releases inside a controlled, sealed chamber and systematically varied temperature, humidity, rain, and CO₂ levels. High-resolution instrumentation, high-speed digital video, and infrared imaging were used to track vapor behavior, liquid accumulation, and solid formation. This combined summary consolidates the technical setup, environmental conditions, results, and practical implications for industry and emergency response.
1. Why the Research Was Conducted
Historically, ammonia release studies have been conducted outdoors, which makes results dependent on wind, sunlight, air exchange, and unpredictable weather. JR III provided a uniquely controlled system, a sealed chamber where every environmental variable could be adjusted and held constant. The study supports major industry priorities:
More accurate hazard-zone modeling for ammonia releases
Better understanding of indoor ammonia gas buildup
Improved ventilation and scrubbing strategies
More confident mass-balance predictions
Safer emergency entry procedures after a release
Data to improve predictive software used by industry and regulators
Because ammonia is now also being evaluated as a low-carbon energy carrier, this research directly supports emerging national risk-assessment needs.
2. Test Chamber and Environmental Conditioning
A carbon-steel chamber was engineered to simulate a sealed industrial space. The usable test volume was reduced to approximately 51 m³ by constructing an insulated internal wall, shortening the conditioning time.
Chamber Characteristics
| Feature | Details ||—|—|| Height | ~9.5 ft (2.9 m) || Width | ~9.5 ft (2.9 m) || Length | 20 ft (6.1 m) || Thermal insulation | 3-in closed-cell spray foam || Wall protection | Alkyd enamel coating + HDPE liners |
The chamber could be conditioned to:
Temperatures: −15°C to 40°C (5°F to 104°F)
Relative humidity (RH): 10% to 90%
Fans were intentionally kept off during most of the experiment to allow natural dispersion; they were activated after 30 minutes to homogenize concentrations.

3. Ammonia Release Method
Source Bottle Details:
12-in (30.5 cm) lecture bottle
Filled with 153 g–199 g of liquefied ammonia
Mounted at a 45° downward angle above a catch tray
Released through a full-bore flow path
A pneumatic remote-release valve was used, rated for:
720 psig design conditions
cryogenic temperatures of −46°C / −50.8°F
A redundant safety valve remained offline unless needed.
The average release duration was 10 seconds, which produced a rapid flash into cold liquid droplets and gas‐phase ammonia. Approximately 0.34 to 0.44 pounds of ammonia were released during each test scenario.
4. Instrumentation Used to Characterize Release Behavior
Multiple sensor types and cameras collected simultaneous real-time data:
Gas Concentration – PIDs
MiniPID2 sensors were deployed at 18 sensor heights at multiple distances.
Characteristics:
Response < 8 seconds
Operational range: −40°C to 65°C
Humidity tolerance up to 90%
Calibration before every test
Conversion factor: 10 mV ≈ 85 ppm

Ammonia release study, sensor placement.
These sensors captured strong concentration gradients, especially during the first 1–5 minutes.
Temperature – Thermocouples
Two probe types were used:
1. Stainless-steel sheathed probes
Used for:
Ammonia vapor temperature
Liquid pooling temperature
2. Exposed-tip probes
Used on walls and external metal surfaces.
Notable readings:
Pooling liquid commonly measured near −60°C / −76°F
Chamber and plume temperatures changed rapidly during jet momentum dissipation
Pressure Measurements
Three pressure transducers recorded:
Lecture bottle pressure drop
Ambient chamber pressure
Rain system injection pressure
Bottle pressure decayed from vapor-pressure equilibrium to ambient during ~10 seconds.
Liquid Mass Measurement
A weighed aluminum tray recorded:
Rained-out liquid ammonia
Evaporation loss
Post-test residue
Resolution capability: 0.2 grams Real-time mass data provided evaporation curves.
Video and IR Imaging
HD Cameras Captured:
plume geometry,
opacity thickness,
liquid motion patterns.
FLIR IR Cameras Captured:
relative temperature distributions,
cooling effect from flash vaporization,
droplet settling patterns.
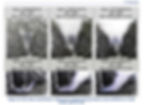
Example imagery showed clear boundary layers:
Cold plume edges surrounded by warmer air
Hot environmental tests yielding minimal liquid footprint

Infrared images of an ammonia release.
5. Behavior During the First Few Minutes After Release
Immediately after discharge:
Jet Impact Behavior
The ammonia jet struck the catch tray, splashing outward
Liquid droplets reflected upward
Vapor shot toward the ceiling
Strong eddies circulated gas across walls and corner boundaries
This caused extreme variation in concentrations at different heights:
Lower sensors initially measured up to −4000 ppm lower than upper sensors
Then reversed to appear 2000–6000 ppm higher
This inversion occurred because:
Large plume bounced upward immediately
Then evaporated liquid in the tray raised concentrations near the floor
It took 10–30 minutes before concentrations converged.
| Short-term initial spike | Up to 6,000 ppm |
| Average concentration after full mixing | 4,300–4,700 ppm |
6. Effects of Environmental Variables
A. Temperature Effects
Temperature was the most dominant factor.
Cold Condition Outcomes (−15°C / 5°F)
Higher liquid yield
Larger droplet sizes
More persistent cloud
Slower vapor-phase mixing
Solid residue formation was observed
Warm Condition Outcomes (35–40°C / 95°F–104°F)
Flashing led to more immediate vaporization
Less liquid captured in tray
Faster concentration equalization
Fewer solids produced
B. Humidity Effects
Humidity directly impacted visibility.
High Humidity (~90%)
Cloud was thick, white, persistent
Likely composed of:
condensed water vapor
entrained ammonia droplets
LC visibility lingered longer near surfaces
Low Humidity (10–25%)
Minimal visible cloud
Most ammonia transitioned to gas immediately
Mixing rate was faster
Cloud visibility was NOT controlled primarily by ammonia quantity—rather, by water vapor condensation.
C. Rain Effects
A controlled rain nozzle discharged droplets during selected tests.
Observed outcomes:
Rainwater actively dissolved ammonia
Mid-field concentrations significantly reduced
Rainout improved gas scavenging from air
Collected water exhibited elevated pH (alkaline)
This confirmed a real-world mitigation principle:
"Rain significantly lowers downwind ammonia exposure levels."
D. CO₂ Interaction Effects
CO₂ did not directly react with ammonia gas upon release, but when moisture was present, carbonic acid formed and reacted with ammonia.
Results:
Solids formed at locations where liquid remained pooled
Residues had measurable pH between 7 and 10
Post-test solids often resembled crystalline powder
Chemical products included:
Ammonium carbonate
Ammonium bicarbonate
Possible ammonium carbamate under cold, low-humidity conditions
CO₂ greatly increased solid persistence time.
7. Solid and Liquid Residue Observations
Residues varied between test conditions.
| Condition | Observation | Cold, dry | Fragile white solids that sublimed rapidly || Warm, humid | Almost no solid formation || CO₂ present | Thick, stable solid deposits remained |
Solid sublimation was documented up to 150 minutes post-release.
Residue location distribution:
Mostly on tray edges
Around base walls
At splash locations where droplets accumulated
8. Practical Real-World Implications
For Industrial Facilities:
A short-duration high-pressure release can lead to prolonged concentration buildup indoors
Pools of liquid ammonia may remain cold enough to continue releasing vapor long after primary event
Fan activation timing affects exposure and spread
For Hazard Analysts:
Initial concentration gradients do not follow textbook plume assumptions
Physical splashing alters deposition zones
Indoor mixing times may exceed 30 minutes
For Responders:
A visible cloud does NOT always indicate high ammonia concentration
Rain or water spray may be an effective mitigation strategy
Delayed entry protocols should consider sustained volatilization from cold pooling
For Model Developers:
Data supports high-resolution dispersion algorithms
Aerosol phase must be included
CO₂–humidity–temperature chemistry must be represented
Conclusion
The JR III controlled chamber study represents the most detailed technical evaluation of pressurized ammonia behavior in an enclosed environment to date. The findings establish that ammonia’s post-release trajectory depends heavily on environmental conditions:
Cold environments prolong liquid phase
High humidity increases cloud visibility
Rain rapidly reduces airborne concentration
CO₂ promotes solid residue formation
Understanding these interactions is critical to improving:
ammonia storage safety,
engineering system design,
emergency response protocols, and
consequence modeling accuracy.
This research provides foundational experimental data that the ammonia industry, safety regulators, academia, and emergency response organizations can use to minimize risk and protect personnel, facilities, and surrounding communities.
Stay tuned to the MySafety blogs. Reach out to us if you have additional questions or concerns. Our team will be pleased to assist you.
Our community can't grow without you, and we deeply appreciate your support.
Please LIKE, SHARE, and FOLLOW our content on social media platforms.
Join our newsletter mailing list to stay up to date on our latest blogs/articles and information.
KEEP IT COOL & SAFE!